Table of Contents
ToggleWhile doing data analysis we tend to group columns to find insights. In Pandas we have a built-in groupby() function. It combines multiple columns making collective operation possible. If it is used by any developer for analysis means he/she is a good developer. Majorly pandas groupby() function is mainly used for summarizing data.
How to use the groupby() function in pandas ?
We will be using a heart disease dataset from Kaggle. Below is the table describing the dataset.
Column name | Description | Data Type |
age | Age of the patient in years | Numeric |
sex | Gender of the patient: 0: female 1: male | Binary |
cp | Type of chest pain: 0: Typical angina 1: Atypical angina 2: Non-anginal pain 3: Asymptomatic | Nominal |
trtbps | Resting blood pressure in mmHg | Numeric |
chol | Serum cholesterol in mg/dl | Numeric |
fbs | Fasting blood sugar level categorized as above 120 mg/dl: 0: false 1: true | Binary |
restecg | Resting electrocardiographic results: 0: Normal 1: Having ST-T wave abnormality 2: Showing probable or definite left ventricular hypertrophy | Nominal |
thalachh | Maximum heart rate achieved during a stress test | Numeric |
exng | Exercise induced angina: 0: no 1: yes | Binary |
oldpeak | ST depression induced by exercise relative to rest(unit -> depression) | Numeric |
slp | Slope of the peak exercise ST segment: 0: Upsloping 1: Flat 2: Downsloping | Nominal |
caa | Number of major vessels (0-4) colored by fluoroscopy | Numeric |
thall | Thalium stress test result: 0: Normal 1: Fixed defect 2: Reversible defect 3: Not described | Nominal |
output | Heart disease status: 0: no disease 1: presence of disease | Binary |
Reading the dataset using pandas.
import pandas as pd
import numpy as np
df=pd.read_csv('heart.csv')
df.head()
Output
    age sex cp  trtbps  chol    ... oldpeak slp caa thall   output
0   63  1   3   145     233     ...     2.3     0   0       1   1
1   37  1   2   130     250     ...     3.5     0   0       2   1
2   41  0   1   130     204     ...     1.4     2   0       2   1
3   56  1   1   120     236     ...     0.8     2   0       2   1
4   57  0   0   120     354     ...     0.6     2   0       2   1
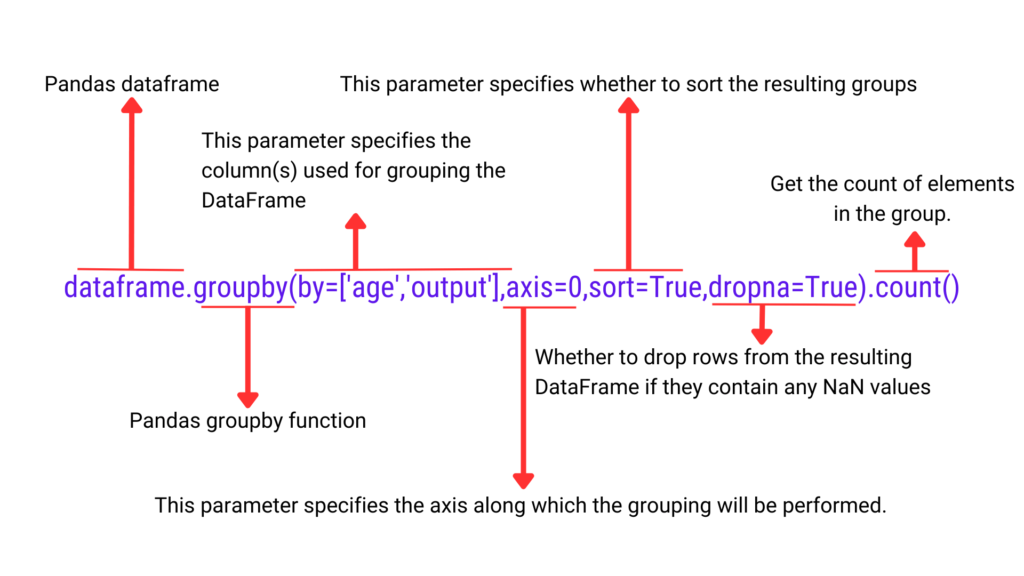
Now, let me explain the syntax of groupby() function in pandas
DataFrame.groupby(by=None, axis=_NoDefault.no_default, level=None, as_index=True, sort=True, group_keys=True, observed=_NoDefault.no_default, dropna=True)
Important parameter in groupby() function.
- by : Key or list of keys that you want to group by. The value of parameter can be a column name or list of column name.
- axis : Here we mention the axis we want to group the dataframe. Default value is axis=0, which means group by row. When we change value to 1, grouping happens by column.
- level : If we have multi index dataframe. By mentioning the level parameter, which is a column name or level number associated with that column allow us to group at that level.
- sort : Appling the value of parameter as true sorts the dataframe. The sorting of dataframe happens on the basis of columns mention in by parameter.
- dropna : This parameter helps in data cleaning while grouping. When the value is true. All rows having missing values from the dataframe are dropped and vice versa if value is false.
Example 1: Using groupby() function to group the data based on the column “output”. Which would help understand the distribution of people having heart disease and vice versa.
# Grouping by the 'output' column
grouped_data = df.groupby(by=['output'],axis=0,sort=True,dropna=True).count()
grouped_data=grouped_data.reset_index()#converts groupby object to dataframe

#renaming the column and printing output
grouped_data.rename(columns={'age':'count'},inplace=True)
grouped_data[['output','count']]
output:
        output	count
0	0	138
1	1	165
In “by” parameter we have to mention the column on which we want to group the dataset. For us the value will be ‘output’. I have to group on row, so the axis value is 0. While grouping we don’t want rows having none value, so we have mentioned dropna as true. Using the count function to get the frequency of classes in ‘output’ column.
Now I will demonstrate use of level parameter in groupby function in pandas.
Creating a dataset of sales with multi index and grouping it based on level parameter in pandas groupby function.
import pandas as pd

data = { 'Sales': [100, 150, 200, 120, 180, 220],
'Profit': [20, 30, 40, 25, 35, 45] }

index = pd.MultiIndex.from_tuples([
('North', 'USA', 'Product1'),
('North', 'USA', 'Product2'),
('North', 'Canada', 'Product1'),
('South', 'Brazil', 'Product1'),
('South', 'Brazil', 'Product2'),
('South', 'Argentina', 'Product1')
], names=['Region', 'Country', 'Product'])

df = pd.DataFrame(data, index=index)
df.head()
                                    Sales   Profit
Region      Country     Product
North       USA         Product1    100     20
                        Product2    150     30
Canada                  Product1    200     40
South       Brazil      Product1    120     25
                        Product2    180     35
            Argentina   Product1    220     45
Grouping the data on product level to find the average sales and profit.
grouped_by_product= df.groupby(level=['Product']).mean().reset_index()
grouped_by_product
Output:
  Product  Sales Profit
0 Product1 160.0 32.5
1 Product2 165.0 32.5
How to use the groupby() multiple columns in pandas ?
In Pandas, we can group by multiple columns at the same time by passing a list of column names to the groupby() function.
Now, Let us understand it through a example with heart disease dataset.
WE will try to understand the distribution of “output” column with respect to “sex” column.
grouped_data = df.groupby(by=['sex','output']).count().reset_index()
grouped_data.rename(columns={'age':'count'},inplace=True)
grouped_data[['sex','output','count']]
Output:
We can see from the given dataset that males are having more heart disease. The count is coming to 93 with sex=1 and output=1.
  sex output count
0 0     0     24
1 0     1     72
2 1     0     114
3 1     1     93
How to use pandas groupby mean function with multiple columns?
Lets write code for finding out how age and gender are related to resting blood pressure ( trbps) and serum cholesterol (chol).
# Group by 'age' and 'sex' columns and calculate the mean of
# 'trtbps' and 'chol' for each group

result = df.groupby(['age', 'sex'])[['trtbps', 'chol']].mean()
print(f"The average resting blood pressure and serum Serum
cholesterol w.r.t age and sex :\n {result}")
Output:
The average resting blood pressure and serum Serum cholesterol w.r.t age and sex :
         trtbps      chol
age sex
29   1   130.000000 204.000000
34   0   118.000000 210.000000
     1   118.000000 182.000000
35   0   138.000000 183.000000
     1   122.666667 224.000000
       ... ... ...
70   1   147.750000 252.500000
71   0   127.333333 238.666667
74   0   120.000000 269.000000
76   0   140.000000 197.000000
77   1   125.000000 304.000000
[73 rows x 2 columns]
How to use pandas groupby filter function with multiple columns?
We use filter function in groupby when we want to get particular groups. Lets get groups based on gender and output with the following conditions
- Where serum cholesterol (‘chol’ column ) mean value is lesser than 250.
- Mean of the ‘oldpeak’ is less than 1
# Group by 'sex' and 'output' columns and filter based
# on mean values of 'oldpeak' and 'chol'.

filtered_data = df.groupby(['sex', 'output']).filter(lambda x:
                    x['chol'].mean() < 250 and x['oldpeak'].mean() < 1 )

print(f"Filtered data \n {filtered_data}")
Output
Filtered data
age sex cp trtbps chol fbs restecg thalachh exng oldpeak slp
0 63 1 3 145 233 1 0 150 0 2.3 0
1 37 1 2 130 250 0 1 187 0 3.5 0
7 44 1 1 120 263 0 1 173 0 0.0 2
.. ... ... .. ... ... ... ... ... ... ... ...
159 56 1 1 130 221 0 0 163 0 0.0 2
160 56 1 1 120 240 0 1 169 0 0.0 0
[93 rows x 14 columns]
How to use pandas groupby apply function with multiple columns?
# Define a custom function to calculate the difference between max and min values
def calculate_difference(group):
    max_val = group.max()
    min_val = group.min()
    return max_val - min_val

# Group by 'sex' and 'output' columns and apply the custom function to 'thalachh' and 'oldpeak'
result = df.groupby(['sex', 'output'])[['thalachh', 'oldpeak']].apply(calculate_difference)

print(f"the difference is as follows \n {result}")
Output:
the difference is as follows
            thalachh oldpeak
sex output
0   0       77.0     6.2
    1       96.0     2.6
1   0       124.0    5.6
    1       97.0     4.2
How to use pandas groupby sort function with multiple columns?
Once we group the dataframe we can sort it using the sort_values() function. Lets group dataframe using column age and output. After grouping we will sort it using age column with help of sort_values function.
# Sorting the mean values of 'chol' within each 'age' group
sorted_df = df.groupby(['age','output']).mean().sort_values('age')
print(f'sorted groups :\n {sorted_df}')
output
Sorted groups:

             sex cp trtbps chol fbs restecg thalachh

age output

29 1        1.0 1.0 130.000000 204.000000 0.000000 0.000000 202.0

34 1        0.5 2.0 118.000000 196.000000 0.000000 0.500000 183.0

37 1        0.5 2.0 125.000000 232.500000 0.000000 1.000000 178.5

... ... ... ... ... ... ... ...

70 1        1.0 1.0 156.000000 245.000000 0.000000 0.000000 143.0

71 1        0.0 1.0 127.333333 238.666667 0.333333 0.666667 139.0

74 1        0.0 1.0 120.000000 269.000000 0.000000 0.000000 121.0
How to use pandas groupby standard deviation function with multiple columns?
Lets write code to calculate the standard deviation of the ‘chol’ column within each group with respect to the ‘sex’ column. In simpler terms, we need to find out how much the cholesterol levels (chol) vary among males and females separately.
# Computing the standard deviation of 'chol' within each 'sex' group
std_dev_df = df.groupby('sex')['chol'].std()
print(std_dev_df)
Output
sex
0   65.088946
1   42.782392
Name : chol, dtype: float64
How to use pandas groupby min function?
“Min” function finds the minimum value of a column within each group. Here, it finds the minimum value of ‘trtbps’ within each ‘sex’ group.
# Finding the minimum value of 'trtbps' within each 'sex' group
min_df = df.groupby('sex')['trtbps'].min()
print(min_df)
output:
Sex
0 94
1 94
Name : trtbps, dtype: int64
How to use pandas groupby max function?
“Max” function finds the minimum value of a column within each group. We are trying to find the highest maximum heart rate achieved during a stress test (‘thalachh’) within each gender group (‘sex’).We will group the data by gender (‘sex’) and then find the maximum value of maximum heart rate (‘thalachh’) within each of these groups.
max_df = df.groupby('sex')['thalachh'].max()
print(max_df)
output:
sex
0   192
1    202
Name : thalachh, dtype: int64
How to use pandas groupby sum function?
# Pandas groupby age and sum based on chol column
sum_df = df.groupby('age')['chol'].sum() # Summing up the 'chol' values within each 'age' group
print(sum_df)
Output:
age
29 204
56 2853
57 4055
...
74 269
76 197
77 304
Name : chol, dtype: int64
How to use pandas groupby percentile function?
Let’s understand percentiles with example and why they are important. Think that you took a test and got 83 out of 100 questions right. The number by itself doesn’t tell you much. But if someone says you’re in the 90th percentile, it means you did better than 90% of the folks who took the same test. So, percentiles help put your performance into context, showing you how well you performed against everyone else.
Here, We compute the 75th percentile of ‘thalachh’ within each ‘age’ group.
# Computing the 75th percentile of 'thalachh' within each 'age' group
percentile_df = df.groupby('age')['thalachh'].quantile(0.75)
print(percentile_df )
Output
age
29 202.00
56 162.50
57 164.00
...
74 121.00
76 116.00
77 162.00
Name : thalachh, dtype: float64
How to plot data after groupby in pandas?
We can use the plot function directly on the resulting DataFrame. Depending on the type of plot you want, you can choose from various plotting functions provided by pandas, such as plot, plot.bar, plot.line, plot.scatter, etc.
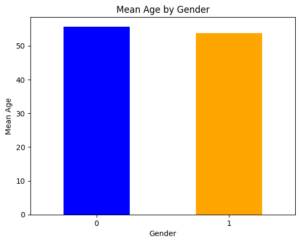
We will show you how to plot histogram after performing pandas groupby function. We want to group by the ‘sex’ column and then plot a histogram of the ‘age’ column by taking its mean.
import matplotlib.pyplot as plt
# Assuming df is your DataFrame containing the data
# Grouping by 'sex' and calculating the mean age for each group
grouped_data = df.groupby('sex')['age'].mean()


# Plotting histogram for each group
grouped_data.plot(kind='bar', color=['blue', 'orange'])
plt.xlabel('Gender')
plt.ylabel('Mean Age')
plt.title('Mean Age by Gender')
plt.xticks(rotation=0)
plt.show()
Output:
How to convert pandas groupby to dataframe?
To create a dataframe we will use reset_index function. Following code lets us understand how to create a dataframe after performing groupby on sex column.
# Perform groupby operation
grouped_df = df.groupby('sex')['age'].mean()

# Convert to DataFrame
result_df = grouped_df.reset_index()

# Display the result DataFrame
print(result_df)
print(type(result_df))
Output
       sex    age
0     0       55.677083
1      1        53.758454
<class 'pandas.core.frame.DataFrame'>
How to convert pandas groupby to dictionary ?
We will use todict function to convert pandas groupby object to dataframe.
# Perform groupby operation
grouped_dict = df.groupby('sex')['age'].mean().to_dict()
# Display the result dictionary
print(grouped_dict)
Output:
{0: 55.677083333333336, 1: 53.75845410628019}
How to convert pandas groupby to list?
We will use tolist function to convert pandas groupby object to dataframe.
# Perform groupby operation
grouped_list = df.groupby('sex')['age'].mean().tolist()

# Display the result list
print(grouped_list)
Output:
[55.677083333333336, 53.75845410628019]
How to use Pandas groupby with the condition?
To perform a groupby operation with a condition in pandas, we can use the groupby function along with boolean indexing. Lets understand with an example:
We will first filter the DataFrame to include only rows where the ‘output’ column equals 1 (indicating presence of disease), and then we perform the groupby operation on the ‘sex’ column. Finally, we can perform any aggregation or other operations on this grouped data.
import pandas as pd
# Assuming df is your DataFrame containing the data
# Grouping by 'sex' column where 'output' column equals 1 (presence of disease)
grouped_data = df[df['output'] == 1].groupby('sex')

# Now you can perform aggregation or other operations on this grouped data
# For example, calculating the mean age for each gender group with heart disease
mean_age_with_disease = grouped_data['age'].mean()

print(mean_age_with_disease)
output
sex
0    54.555556
1    50.903226
Name : age, dtype: float64
Conclusion:
In this blog we have understood how to use Pandas Groupby Function With Multiple Columns. Pandas groupby function is one of the most important function while performing data analysis using pandas.